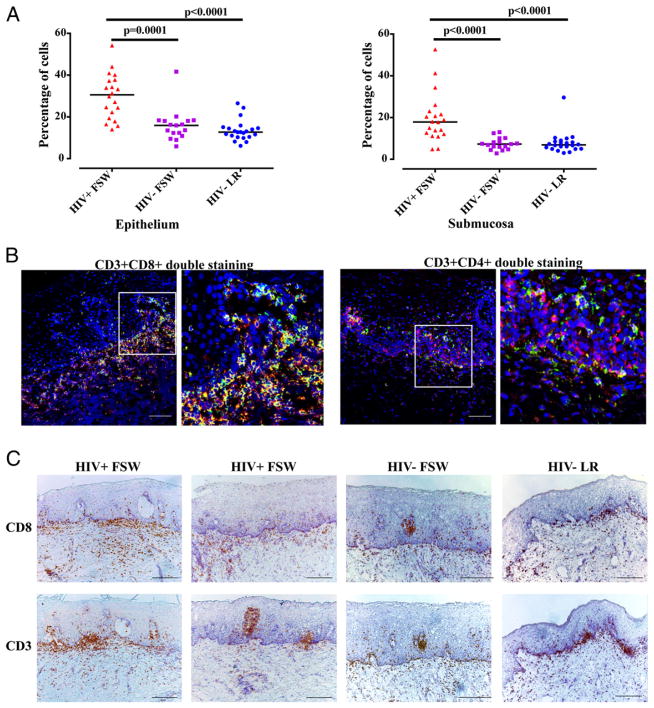
FIGURE 1.
Enumeration and in situ staining of immune cells in ectocervical tissue. (A) Distribution and median of the percentage of total cells in the ectocervical epithelium and submucosa of tissue samples from the three study groups. A nonparametric, two-tailed Mann–Whitney U test was used to compare the HIV+FSW group versus the HIV−FSW group and the HIV+FSW group versus the HIV−LR group. (B) Immunofluorescent images of ectocervical tissue sections from an HIV+FSW subject. The image on the right for each pair is a magnified view of the region indicated in the box in the image to the left. The majority of CD8+ cells (red) were also CD3+ (green) and vice versa (left panels); the majority of CD3+ cells (red) were not CD4+ cells (green) (right panels). Scale bar, 100 μm. (C) Bright-field images of ectocervical tissue stained with hematoxylin (blue) for visualization of cell nuclei and stained for CD8+ cells (brown; upper panels) and CD3+ cells (brown; lower panels). Scale bar, 200 μm.

