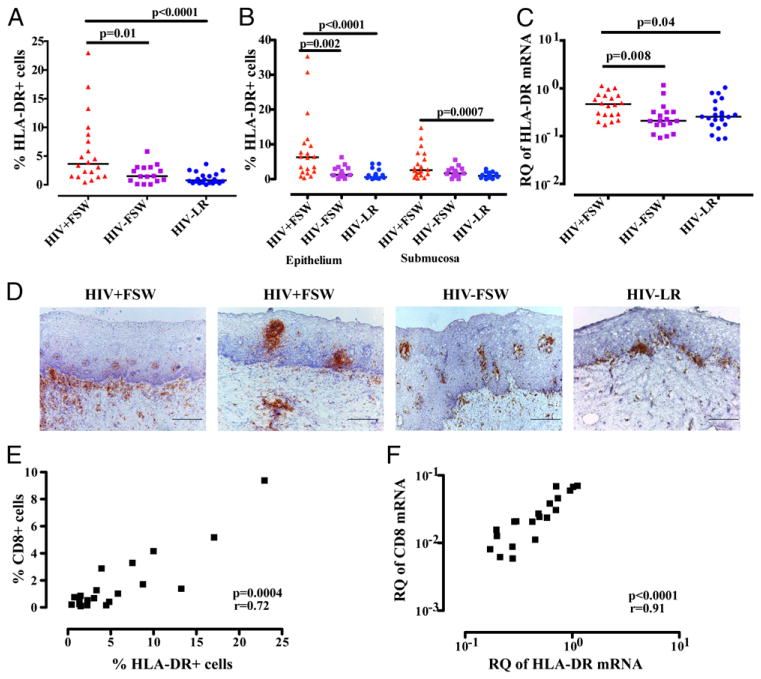
FIGURE 5.
Enumeration of HLA-DR+ cells and HLA-DR mRNA expression in ectocervical tissue. Distribution and median of the percentage of positively stained HLA-DR+ cells in (A) the total tissue analyzed (B) and in the ectocervical epithelial and submucosal tissue area analyzed separately, as assessed by imaging analysis. (C) Relative quantification (RQ; UBC = 1) of HLA-DR mRNA expression, which was assessed by qPCR. A nonparametric, two-tailed Mann–Whitney U test was used to analyze statistical significance between the HIV+FSW group versus the HIV−FSW group and the HIV+FSW group versus the HIV−LR group. (D) Bright-field images of human ectocervical tissue stained with hematoxylin (blue) for visualization of cell nuclei and stained for HLA-DR (brown). Scale bars, 200 μm. (E) Correlation between the percentage of CD8+ cells and percentage of HLA-DR+ cells within the total ectocervical tissue area, as assessed by imaging analysis in the HIV+FSW group. (F) Correlation between the RQ of CD8 and HLA-DR mRNA levels, as assessed by qPCR, in the HIV+FSW group. Spearman rank correlation coefficient test was used to assess the correlation.

