
Figure 3.
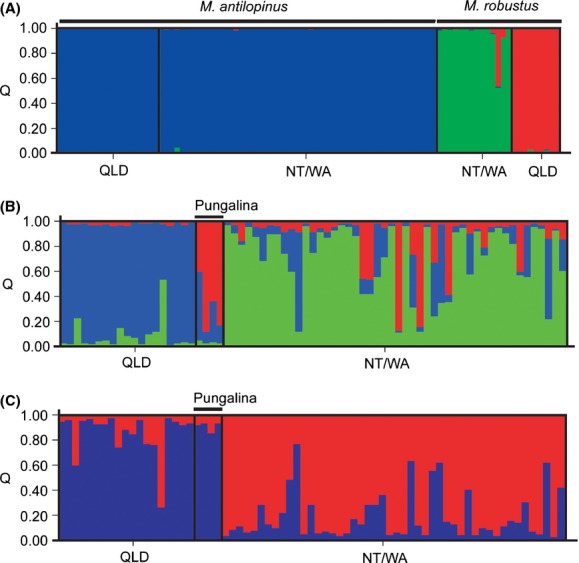
Structure plot showing proportion of inferred ancestry (Q) in the genetic clusters identified withinMacropus antilopinus andMacropus robustus in Northern Australia. For each species, individuals are ordered by decreasing geographic distance from the Carpentarian barrier for the first population and increasing distance for the second. (A) CombinedMacropus antilopinus andM. robustus (K = 3). (B)M. antilopinus only (K = 3). (C)M. antilopinus only (K = 2).