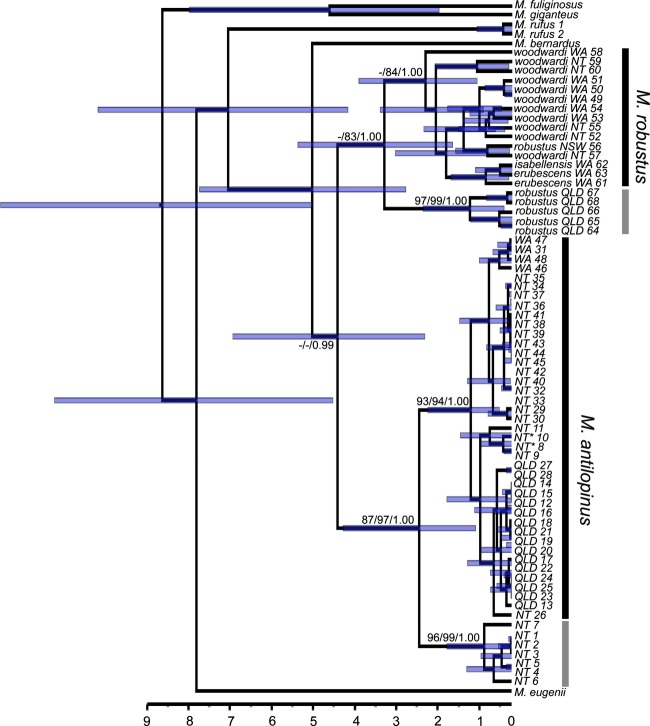
Figure 4.
Chronogram inferred from control region (CR) haplotypes ofMacropus antilopinus and Macropus robustususing a relaxed molecular clock in Beast based on the normal prior distribution of fossil calibrations. Values at the nodes represent the mean time since divergence; node bars represent 95% confidence intervals. The scale bar is in millions of years. Individuals from the divergent clade are indicated by the light-shaded bar. Numbers on major branches indicate bootstrap (maximum-likelihood, maximum-parsimony) support or posterior probability (Bayesian) when ≥80% or 0.08. Haplotypes are labeled as in Table S2 and with a broad geographic location.

