Figure 2.

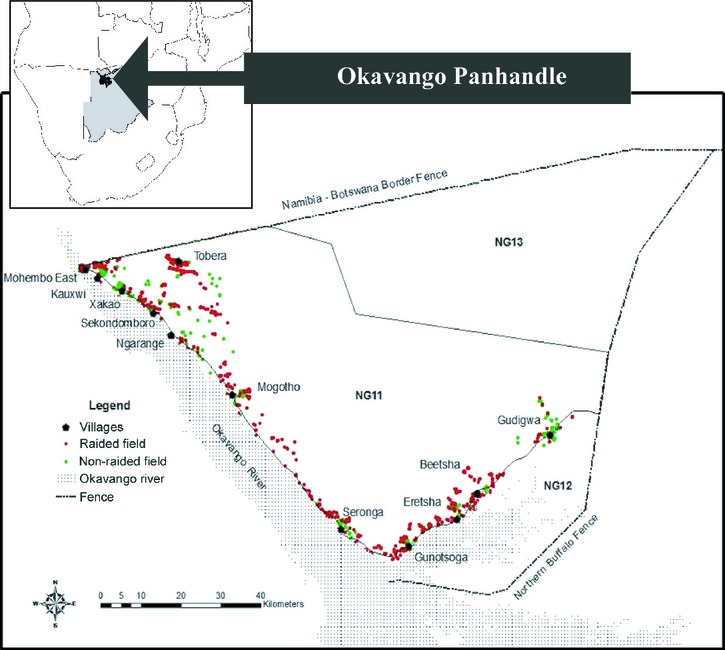
Map of the study area, with raided (red points) and nonraided (green points) field distributions in 3 years (2008–2010) illustrated.

Map of the study area, with raided (red points) and nonraided (green points) field distributions in 3 years (2008–2010) illustrated.