Figure 6.

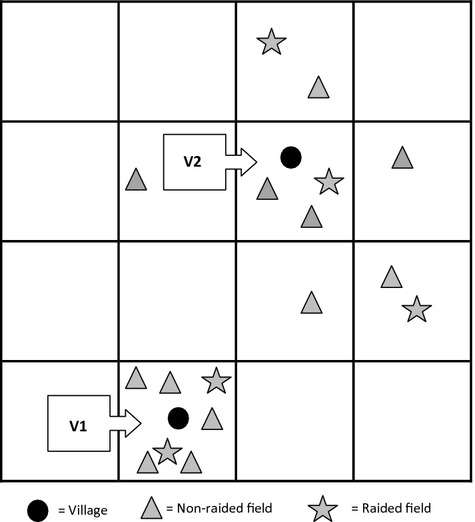
Schematic diagram explaining change in model estimates, and P-values of distance to village covariate when subsampling to reduce effect of spatial autocorrelation.

Schematic diagram explaining change in model estimates, and P-values of distance to village covariate when subsampling to reduce effect of spatial autocorrelation.