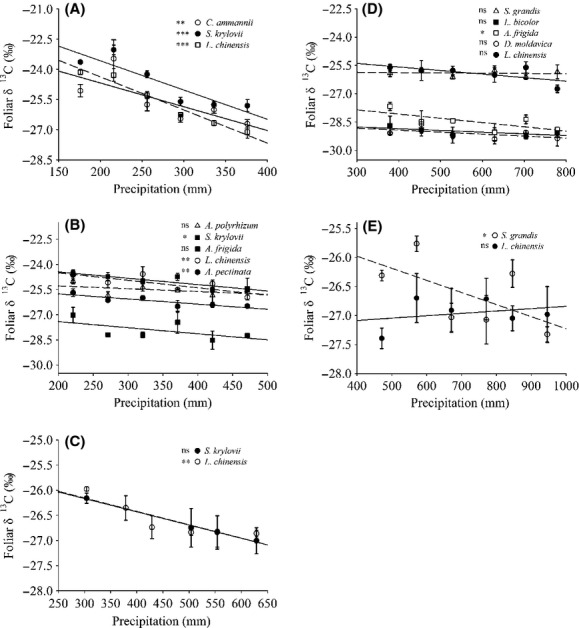
Figure 3.

Response pattern of foliar δ13C to precipitation in common species at each site. (A–E) represent the pattern in common species at different sites. (A) Site I: Convolvulus ammannii, Stipa krylovii, Leymus chinensis; (B) Site II: Allium polyrhizum, S. krylovii, Artemisia frigida, L. chinensis, Artemisia pectinata; (C) Site III:S. krylovii,L. chinensis; (D) Site IV:Stipa grandis,Lespedeza bicolor,A. frigida,Dracocephalum moldavica,L. chinensis; (E) Site V: S. grandis,L. chinensis. The precipitation shown in these figures is equal to the sum of the local mean annual precipitation plus the amount of water applied to each plot. Each point is the mean of foliar δ13C ± 1SE. Where a point has no error bars, it is a missing value. Asterisks indicate the levels of significance, and “ns” stands for “not significant” levels.
