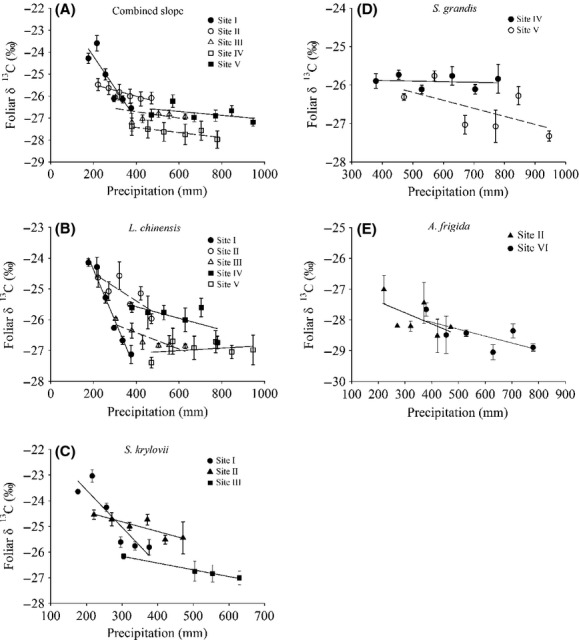
Figure 4.

Response pattern of foliar δ13C to precipitation between sites for common species at different sites. (A) Combined slope for all species of each site. (B–E) Patterns of common species collected from different sites: (B), Leymus chinensis; (C), Stipa krylovii; (D), Stipa grandis; (E), Artemisia frigida. The precipitation shown in these figures is equal to the sum of the local mean annual precipitation plus the amount of water applied to each plot. Each point is the mean of foliar δ13C ± 1SE. Where a point has no error bars, it is a missing value.
