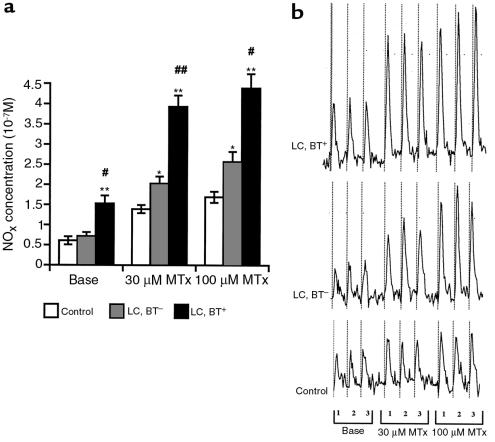
Figure 2.
(a) Absolute perfusate NOx concentrations under basal conditions and during pressure-response periods to MTx. *P < 0.01 vs. control. **P < 0.0001 vs. control. #P < 0.001 vs. LC, BT–. ##P < 0.0001 vs. LC, BT–. (ANOVA for pressure-response periods: P < 0.0001 for control vs. LC, BT– or LC, BT+ rats; P < 0.001 for LC, BT+ vs. LC, BT– rats.) (b) Representative NOx assays by chemiluminescence technique for rats of each study group. At baseline conditions and during pressure-response periods to 30 μM and 100 μM MTx, 3 perfusate samples (1, 2, 3) were collected, each for 1 minute. An increase in peak size (area under the curve) obtained in cirrhotic rats compared with that of controls and a further increase in peak size in readings from cirrhotic rats with BT is evident.

