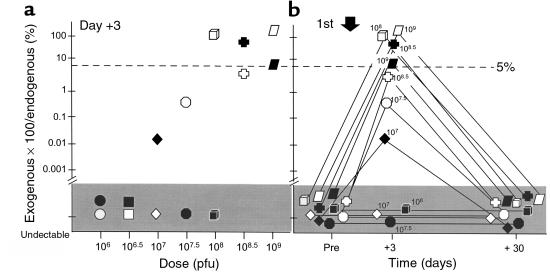
Figure 4.
Quantitative assessment of the airway epithelium for the percentage of exogenous CFTR mRNA (derived from the AdGVCFTR.10 vector) compared with endogenous CFTR mRNA (individual’s own CFTR gene expression) as a function of dose and time (baseline, days 3 and 30) after endobronchial spray of the first administration (cycle 1) of the AdGVCFTR.10 vector. The dashed line represents the 5% level of exogenous vector-derived CFTR mRNA. Each symbol represents a different individual (see Table 1). (a) Function of dose at day 3. (b) Function of time. The data for the 106 and 106.5 doses (undetectable at each time point for all subjects) are not shown in b. “Pre” is before first vector administration.

