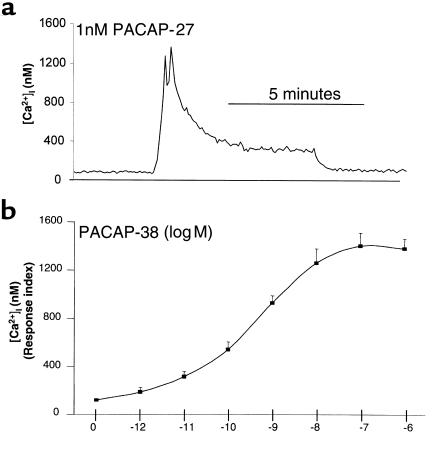
Figure 2.
PACAP-induced stimulation of Ca2+i in ECL cells. (a) PACAP-induced intracellular signaling in isolated ECL cells: video imaging using Fura-2/AM–loaded ECL cells as detailed in text. PACAP-27 was administered at a dose of 1 nM; the induction of a typical biphasic Ca2+ release is shown. (b) Dose response to PACAP of the averaged [Ca2+]i stimulation in response to various concentrations of PACAP-38. Data are presented as the Ca2+ response index, calculated as: (peak [Ca2+]i of responding cells × the percentage of cells responding)/100.

