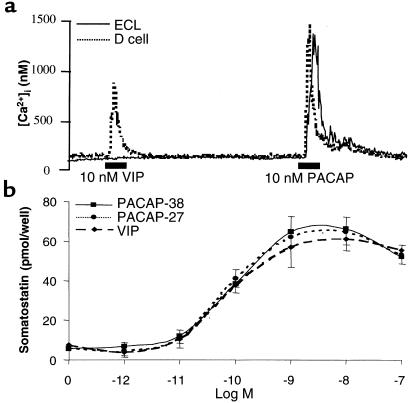
Figure 5.
Effects of VIP and PACAP on D cells. (a) Comparison of the effects of VIP and PACAP on [Ca2+]i in isolated D cells and ECL cells in the same preparation. For these experiments, Fura-2 was used as the Ca2+i probe; data represent at least 3 experiments on those preparations. (b) Stimulation of somatostatin secretion in isolated rat gastric D cells by the indicated concentrations of PACAP-38 (circles), PACAP-27 (triangles), and VIP (squares). Data are representative of the mean of 4 experiments; error bars reflect SEM; n = 4.

