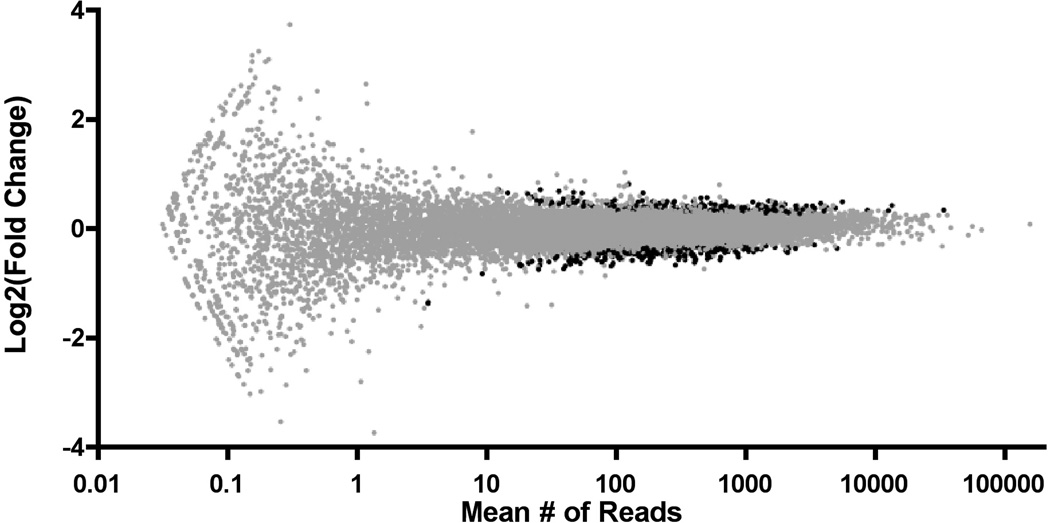
Figure 2.
Global differential gene expression changes are shown above, as calculated with DE-Seq v1.82. Each defined gene with >0 reads is placed on the x-axis according to average number of mapped reads and on the y-axis according to Log2(LSD counts/Control counts). Differentially expressed genes (adj. p<0.05) are shown in black.

