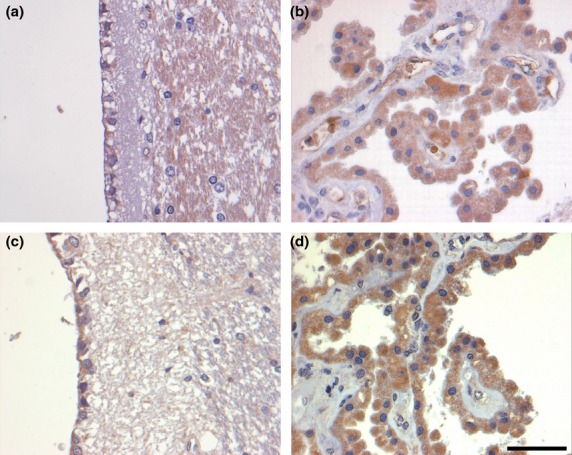
Figure 1.

G-CSF and G-CSF R IR in ependymal cells (a and c, respectively) and cells of the choroid plexus (b and d, respectively) of control brains. There is only faint G-CSF IR in ependymal cells (a), whereas staining for the G-CSF R is stronger (c). The choroid plexus reveals faint to moderate labeling for the ligand (b), whereas, again, staining for the receptor is slightly more intense (d). Sections are counterstained with hematoxylin. Scale bar: 50 μm.
