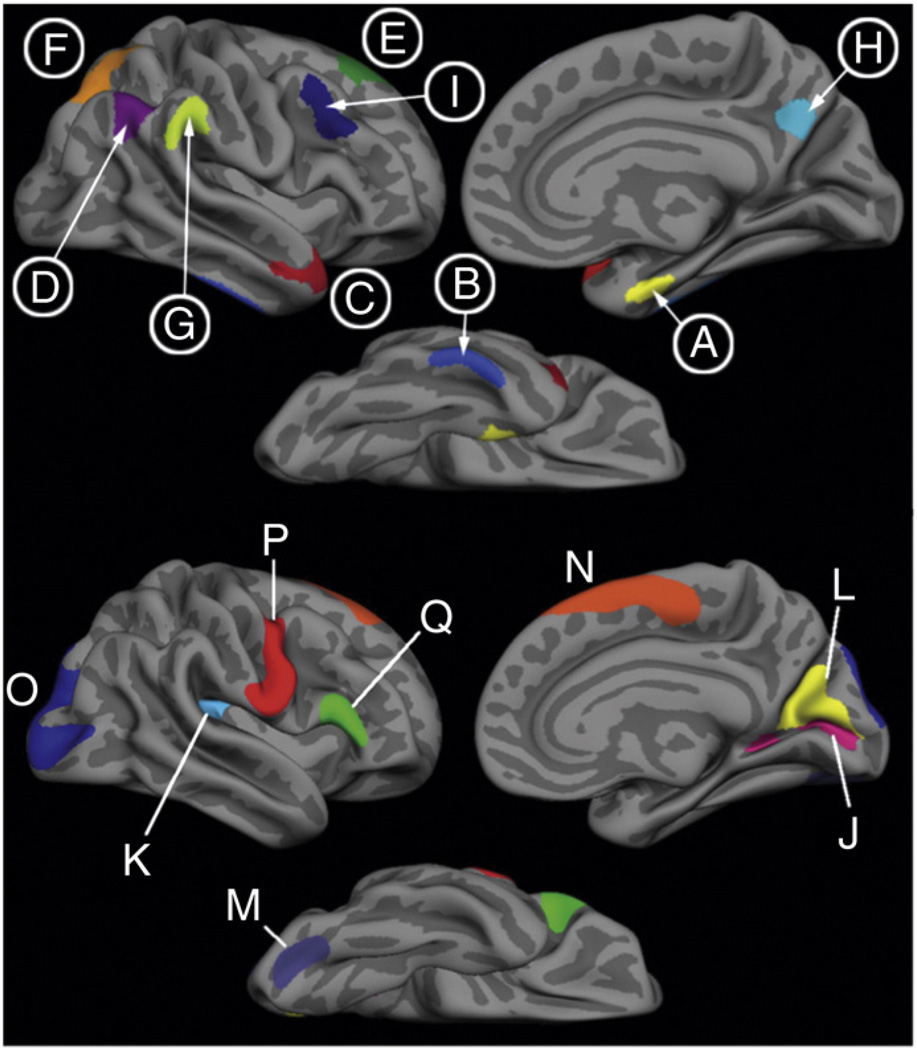
Fig. 2.
Top) “AD signature” ROIs. Labels A, B, C, F and H are AD-specific ROIs, where atrophy is seen primarily in AD. Labels D, E, G and I are aging-AD overlap ROIs, where atrophy is seen in both aging and AD. Bottom) “aging-specific” ROIs, where atrophy is seen primarily in normal aging with minimal additional effect of AD.

