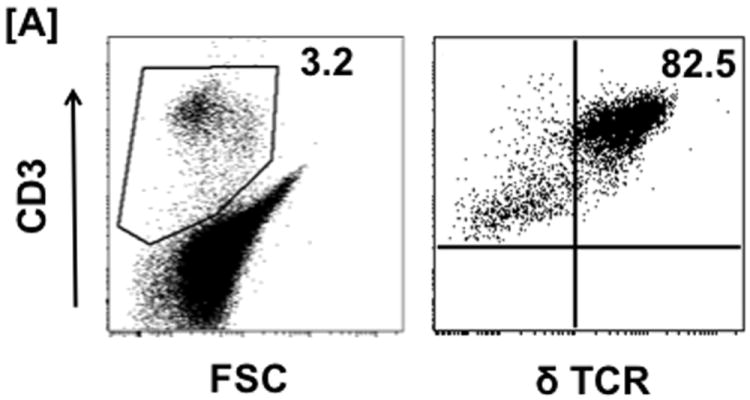
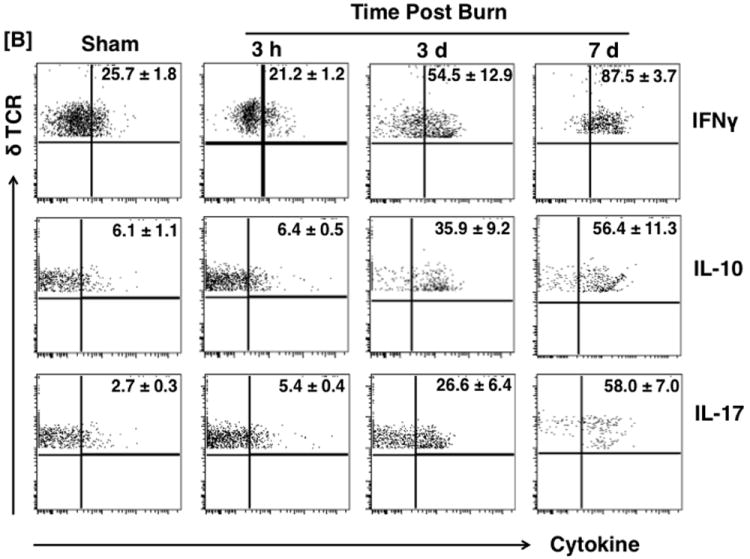
Figure 1.


Th profiles during burn injury. Three Hours, 3 and 7 days after sham or burn procedure, skin cells were prepared and Th profiles [Th1 (IFNγ), Th2 (IL-10) and TH17 (IL-17)] of γδ and αβ T-cells were determined by means of flow cytometry. [A] Gating strategy. [B] Gating strategy and represents the percentages of γδ T-cells positive for IFNγ, IL-10 and IL-17 cytokines; population shown in the upper right quadrants of the dot plots. The numbers in the dot plots indicate the mean ± SEM of respective population. [C] Graphs demonstrate the Percentage (upper panel) and MFI (lower panel) of the γδ T-cells positive for different cytokines. Data are mean ± SEM for 3-8 mice/group; *p < 0.05 vs. respective sham.
