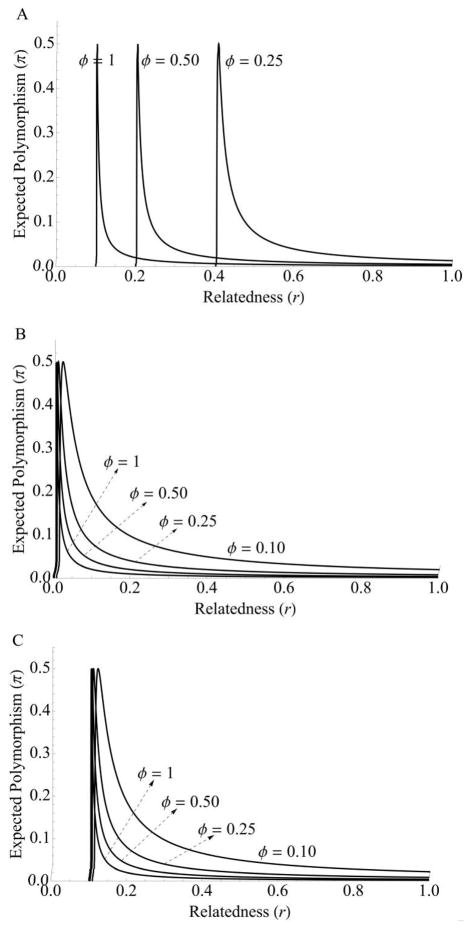
Figure 1.
Expected polymorphism at quorum sensing (QS) loci. Curves represent expected polymorphism as a function of relatedness, r, and frequency of QS expression, ϕ. Note that in every case, polymorphism increases as relatedness and the frequency of expression decrease. The unimodal curve results from the fact that polymorphism has a maximum at π = 0.5. When allele frequency is greater than 0.5, the polymorphism begins to decrease toward 0 (see eq. [1]). The sharp drop in polymorphism at low relatedness after the peak corresponds with fixation of the mutant allele, which eliminates polymorphism and creates a fixed difference between species. Comparison of these plots shows that we would expect greater polymorphism for the signal locus than the response regulator under model 1 but lower polymorphism of signal than the response regulator if model 2 holds. Furthermore, the response regulator can maintain lower mutation load at low frequency of expression, ϕ, than can the signal locus under model 1, where infrequent expression allows cheaters to spread rapidly. Parameter values are as follows: cR = cS = 0.01, bR = 0.10, μ = 10−4, and N = Ne = 1,000.

