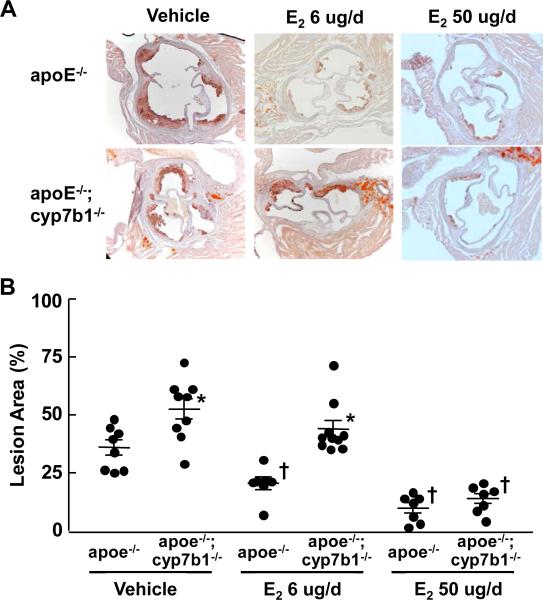
Figure 3.
27HC attenuate E2-related atheroprotection. A. Representative images of aortic roots in female apoe−/− versus apoe−/−;cyp7b1−/− mice ovariectomized at 12 weeks of age, fed a western diet and treated with vehicle, 6 ug/d E2 or 50 ug/d E2 for 8 weeks. B. Summary data are provided in scatter plots. Mean values are indicated by the long horizontal line, and SEM by the short horizontal line. *p<0.05 vs apoe−/−, †p<0.05 vs vehicle. See also Figures S2 and Table S3.

