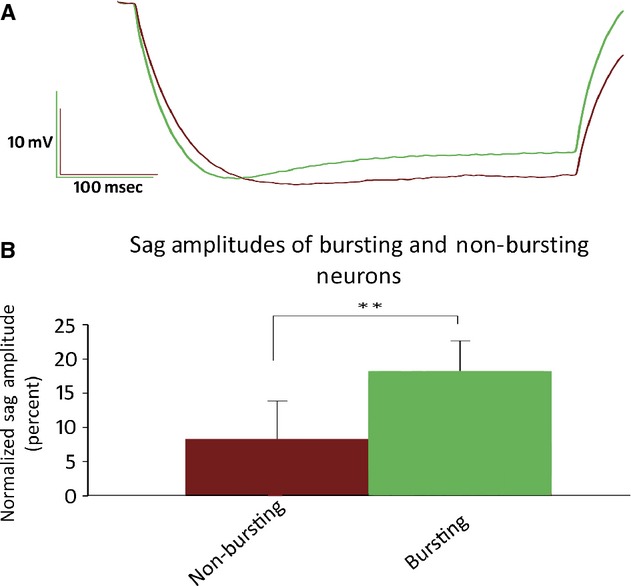
Figure 2.

(A) Averaged traces recorded in response to a 450 msec 150 pA hyperpolarizing current injection. Traces from cells that fired ROB action potentials are depicted in green (n = 7), whereas cells that did not produce ROB are depicted in maroon (n = 7). (B) Normalized sag amplitudes of bursting and nonbursting cells. Sag amplitudes were calculated as the differences between the maximal hyperpolarization amplitudes and the amplitudes at 400 msec. Sag amplitudes are expressed as a percentage of the maximal hyperpolarization. Bursting neurons displayed significantly larger hyperpolarization‐mediated sags (18.2 ± 4.38%) than nonbursting neurons (8.30 ± 5.56%, P < 0.01 one‐tailed, unpaired t‐test).
