Figure 3.
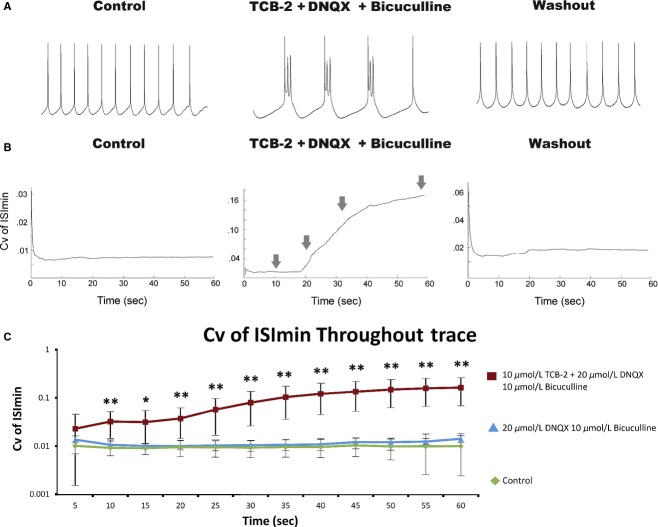
(A) Expanded sections (30–32 sec) from 60 sec traces recorded from the same cell depicted in Figure 1. All traces displayed were recorded from the same cell before, during application of, and after washout of 10 μmol/L TCB‐2, 20 μmol/L DNQX, and 10 μmol/L bicuculline. (B) Example curves of the coefficients of variation (σ/μ) of ISImin calculated from a 6‐point moving average throughout 60 sec traces. Curves were generated from the same traces depicted in Figure 2A. Notice the difference in scale ranges between conditions (control 0–0.03, TCB‐2 + bicuculline and DNQX 0–0.18, washout 0–0.06). Arrows denote time of traces in Figure 1B. (C) Means of Cv curves sampled at 5 sec intervals (n = 7 cells). In the presence of TCB‐2, bicuculline, and DNQX, cells displayed significantly greater Cv of ISImin than either control conditions or bicuculline and DNQX alone (paired t‐tests, *P < 0.05, **P < 0.01). Note that these data are plotted on a logarithmic scale. Error bars represent standard deviation.

