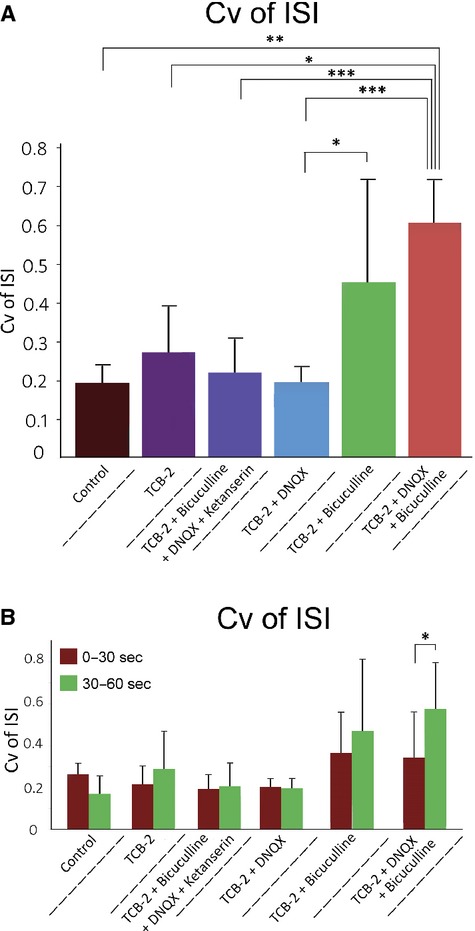
Figure 4.

(A) Differences in Cv of ISI resulting from administration of various drug combinations. Cv was calculated from full 60 sec traces. Mean values and standard deviations of data represented in this figure are displayed in Table 1. One‐tailed, unpaired t‐tests were conducted between groups assuming unequal variance. Asterisks denote statistical significance: *P < 0.05, **P < 0.01, ***P < 0.001. (B) Cv of ISI calculated from same data depicted in A. For each treatment group, Cv is reported from 0 to 30 and 30 to 60 sec to demonstrate changes in Cv during recordings. The Cv in the first 30 sec (mean = 0.46 ± 0.21) recorded in cells perfused with TCB‐2, DNQX, and bicuculline was significantly lower than the Cv of the last 30 sec (mean = 0.69 ± 0.21, P = 0.036, paired t‐test).
