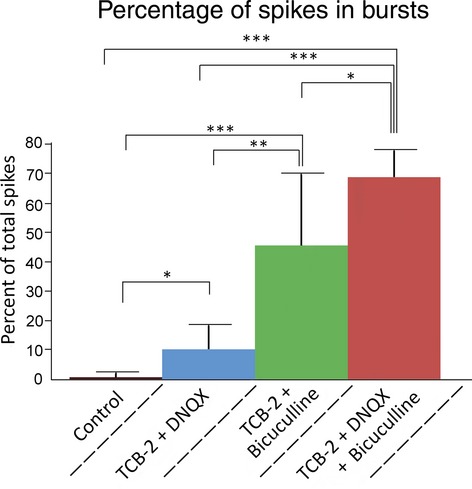
Figure 6.

Percentage of spikes fired in bursts throughout 60 sec traces. Intraburst periods were calculated based on changes in ISImin where burst initiations and terminations were classified as any periods where ISImin(n + 1) − ISImin(n) >2 mV and ISImin(n + 1) − ISImin(n) <−2 mV, respectively. Mean values for figures are: Control 0.7 ± 1.2, TCB‐2 + DNQX 10.2 ± 7.8, TCB‐2 + bicuculline 34.7 ± 33.5, and TCB‐2 + DNQX + bicuculline 68.7 ± 9.2. One‐tailed unpaired t‐tests were conducted between groups assuming unequal variance. Asterisks denote statistical significance: *P < 0.05, **P < 0.01, ***P < 0.001.
