
Figure 7.
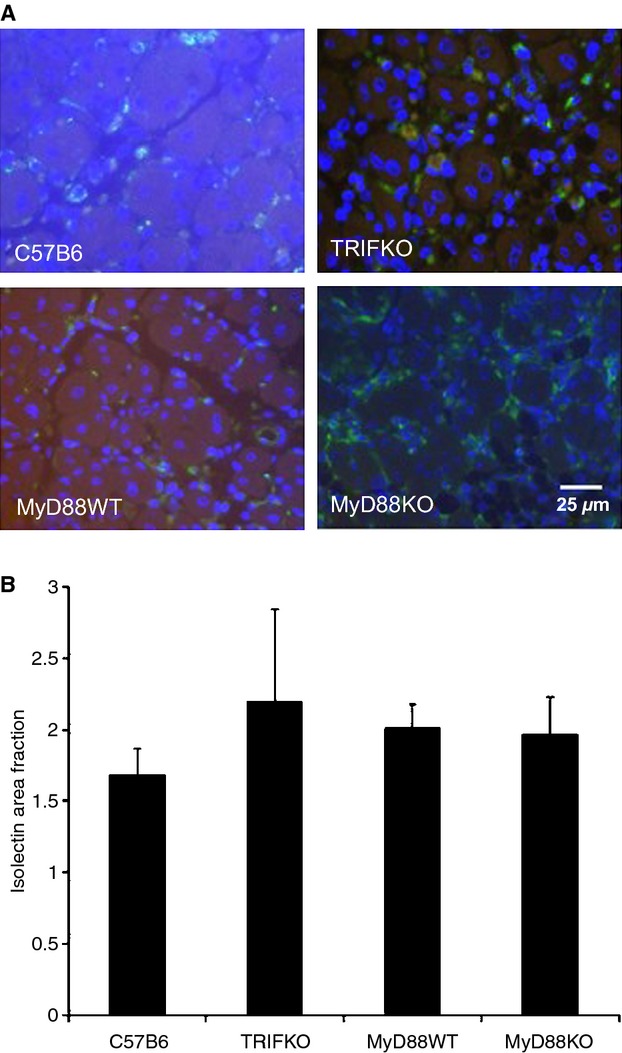
(A) Isolectin staining (green) in ischemic hindlimbs was assessed using a 40× objective 2 weeks after ischemic injury. Contrast was adjusted equally for all images to allow for visualization of green and blue. (B) Area fraction of isolectin staining in each strain is shown, indicating no significant quantitative difference in staining across the strains.