Figure 4.

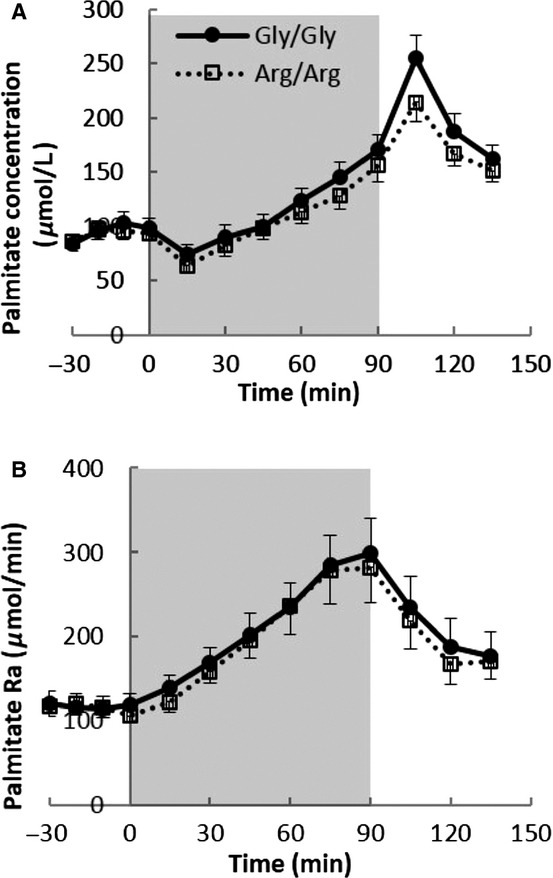
(A) The plasma palmitate concentration and (B) the rate of plasma palmitate appearance (Ra) during the exercise study. Column background (0–90 min) represent exercise period. n =16 in both Gly/Gly and Arg/Arg groups for the exercise study.

(A) The plasma palmitate concentration and (B) the rate of plasma palmitate appearance (Ra) during the exercise study. Column background (0–90 min) represent exercise period. n =16 in both Gly/Gly and Arg/Arg groups for the exercise study.