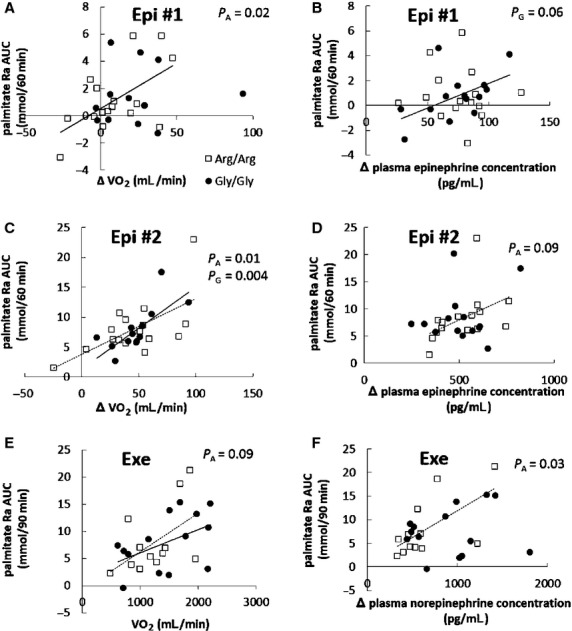
Figure 5.

Relationship between ΔVO2 and palmitate Ra AUC in submaximal (A: n =16 in Arg/Arg and n =12 in Gly/Gly group), maximal (C: n =16 in Arg/Arg and n =13 in Gly/Gly group) epinephrine infusion, and exercise trial (E: n =12 in Arg/Arg and n =14 in Gly/Gly group). Relationship between plasma catecholamine concentrations and palmitate Ra AUC in submaximal (B: n =15 in Arg/Arg and n =14 in Gly/Gly group), maximal (D: n =15 in Arg/Arg and n =13 in Gly/Gly group) epinephrine infusion, and exercise trial (F: n =12 in Arg/Arg and n =14 in Gly/Gly group) in Arg/Arg (□) and Gly/Gly (●) subjects. Regression lines were depicted where there were statistically significant or borderline differences in Arg/Arg (dashed line, PA) and Gly/Gly (solid line, PG) subjects.
