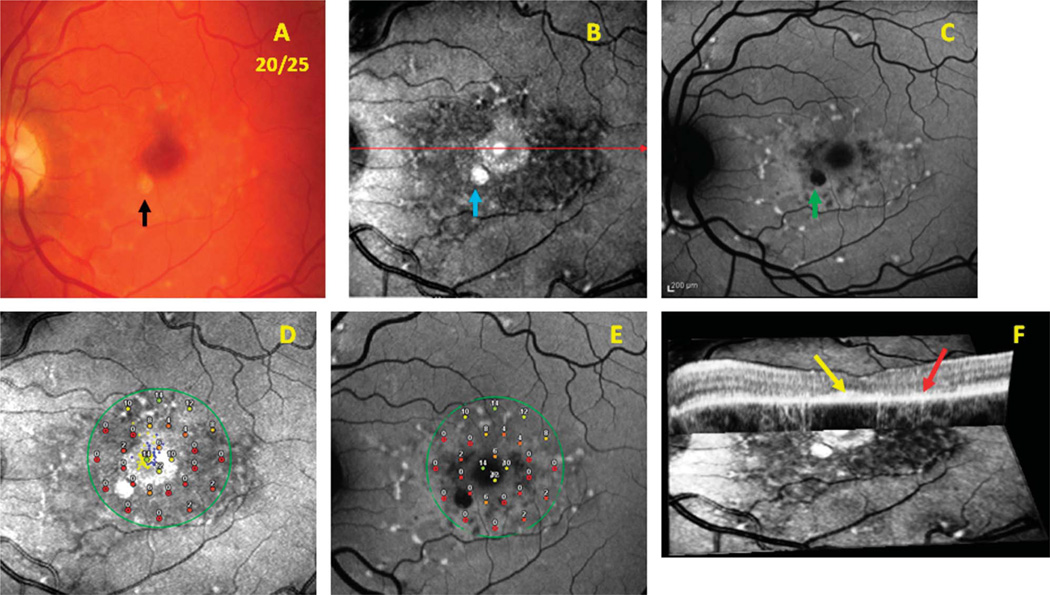
Fig. 1.
Patient 10. Images from a patient with Stage 2 Stargardt disease comparing results from the infrared-SLO, SW-AF, SD-OCT, and MP testing. A. Color fundus photograph. B. Infrared-SLO image. C. Short-wavelength fundus autofluorescence image. D. Results from MP superimposed on an infrared-SLO image. E. Results from MP superimposed on a SW-AF image. F. Cross-sectional OCT image superimposed on the surface of an infrared-SLO image.

