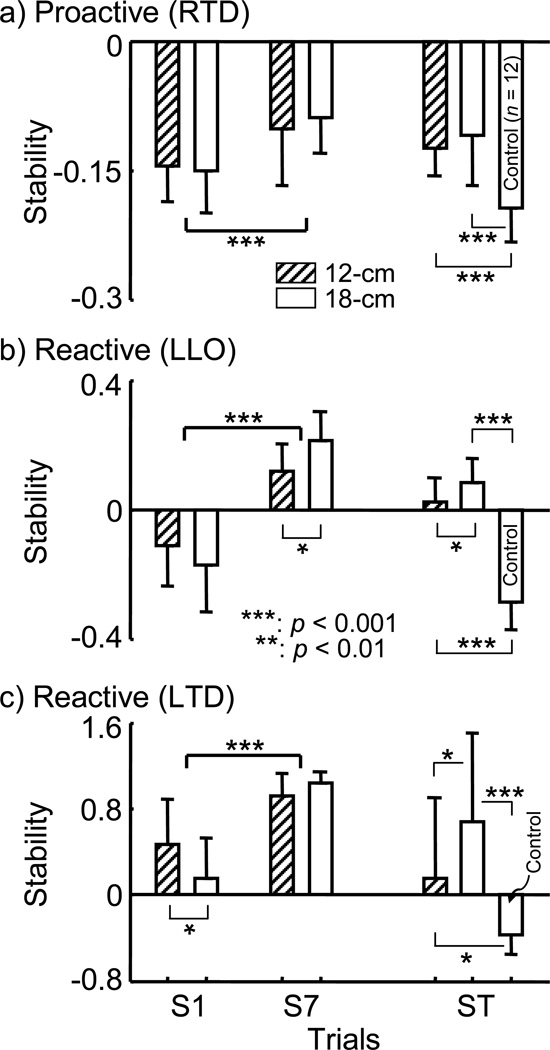
Figure 4.
Comparisons of dynamic preslip stability at slipping foot touchdown (RTD), b) post-slip stability at recovery foot liftoff (LLO), and c) post-slip stability at recovery foot touchdown (LTD) for both training groups (12-cm and 18-cm) upon their first (S1) and last (S7) training slips, and for both training groups and the control group on their 150-cm slip test (ST). The thick line indicates the p value for the main trial factor while thin line represents the p value for the post-hoc analysis.

