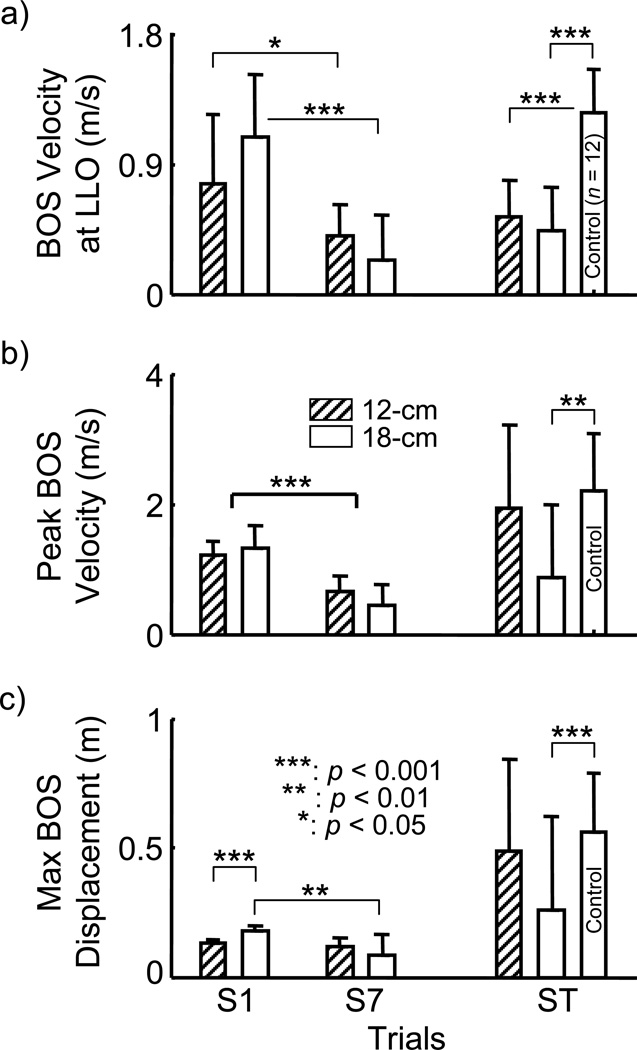
Figure 6.
Group mean and standard deviation of a) base of support (BOS) velocity at left foot liftoff (LLO) after slip onset, b) peak base of support (BOS) velocity, and c) maximum BOS displacement for both training groups (12-cm and 18-cm) upon their first (S1) and last (S7) training slips, and for both training groups and the control group on their 150-cm slip test (ST). The thick line indicates the p value for the main trial factor while thin line represents the p value for the post-hoc analysis.

