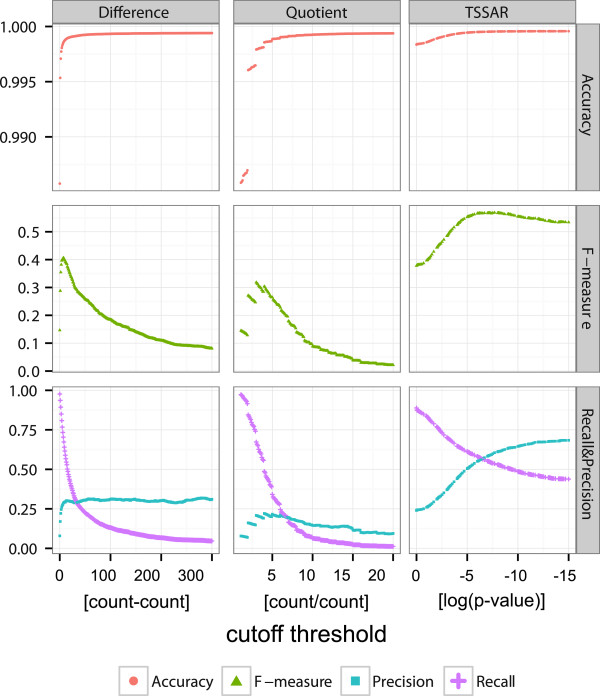
Figure 3.
Evaluation of TSSARperformance. Comparison of the prediction power of TSSAR against two fixed-cutoff approaches Difference and Quotient. For each method different cutoff thresholds were applied. The difference, quotient and logarithm of the p-value are plotted along the x-axis. Please note, for comparability the log(p-value) is plotted in descending order from left to right. The resulting predictions were evaluated by calculating the recall rate, precision, F-measure and accuracy. The dynamic approach of TSSAR clearly outperforms the remaining in all aspects. Since only TSSAR applies a clustering of consecutive TSS positions, this effect was separately examined, results can be found in Additional file 1: Figure S5.

