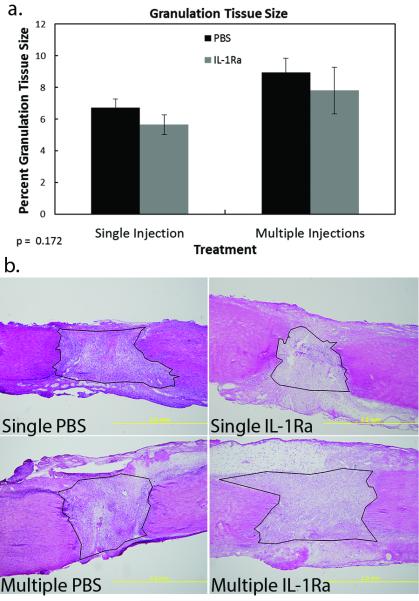
Figure 2. Size of granulation tissue of the MCL after PBS or IL-1Ra treatment.
Graph demonstrating the effect of single or multiple treatments of PBS or IL-1Ra on granulation tissue size (a). No significant differences were noted. Data was considered significant when p< .05. Values are expressed as mean cell numbers ± S.E.M. Representative micrographs of H&E stained day 5 MCLs after single or multiple treatments of PBS or IL-1Ra (b). Black lines encircling the granulation tissue represent examples of how the granulation tissue was measured.

