Figure 6.

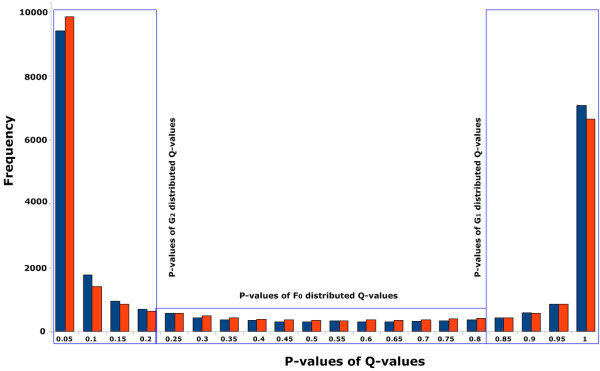
p-value distributions of and-values for human EGFR protein (PDB-Entry 2J6M). The blue bars illustrate the p-value distribution of the -values and red bars display the p-value distribution of the -values.

p-value distributions of and-values for human EGFR protein (PDB-Entry 2J6M). The blue bars illustrate the p-value distribution of the -values and red bars display the p-value distribution of the -values.