
Figure 2.
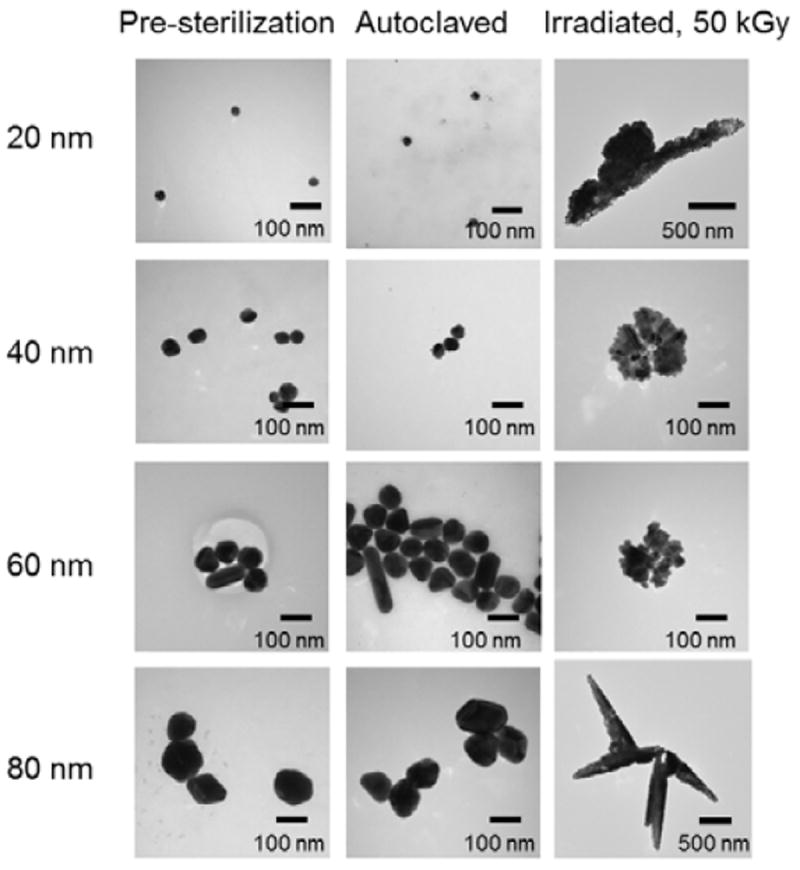
Representative TEM images of silver nanoparticles (20, 40, 60, and 80 nm) before and after sterilization treatments. The sterilization included autoclave and gamma irradiation at 3 different doses (15, 25 and 50kGy). Shown are results from irradiation at 50kGy, other doses resulted in similar changes. All scale bars are 100 nm unless otherwise noted.