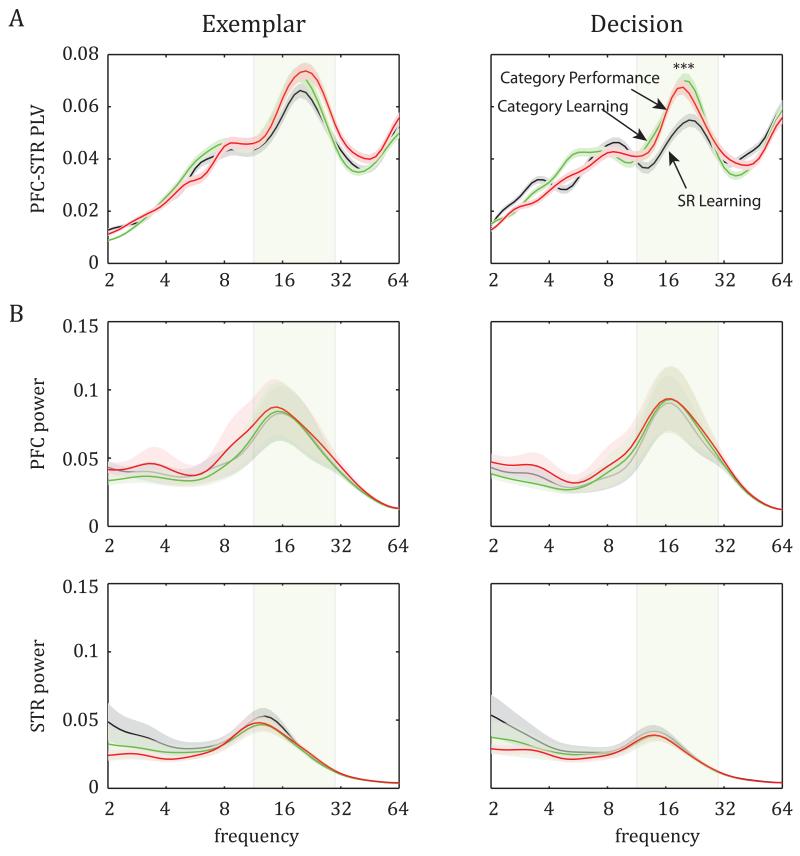
Figure 2.
Frequency-specific oscillations in PFC and striatum (STR) during two trial epochs (exemplar and decision) across the three stages of learning. A. Average PLV ± SEM as a function of frequency: Peak synchrony between PFC and STR beta-band oscillations (in this and all figures, shaded rectangle indicates the 12-30 Hz beta band), and learning-induced enhancement of this synchrony during the decision epoch (see also Figs. S1, S2, and Table S1). B. Average spectral power (±SEM) in PFC (top) and STR (bottom) is high at the beta band, but does not change across learning stages.

