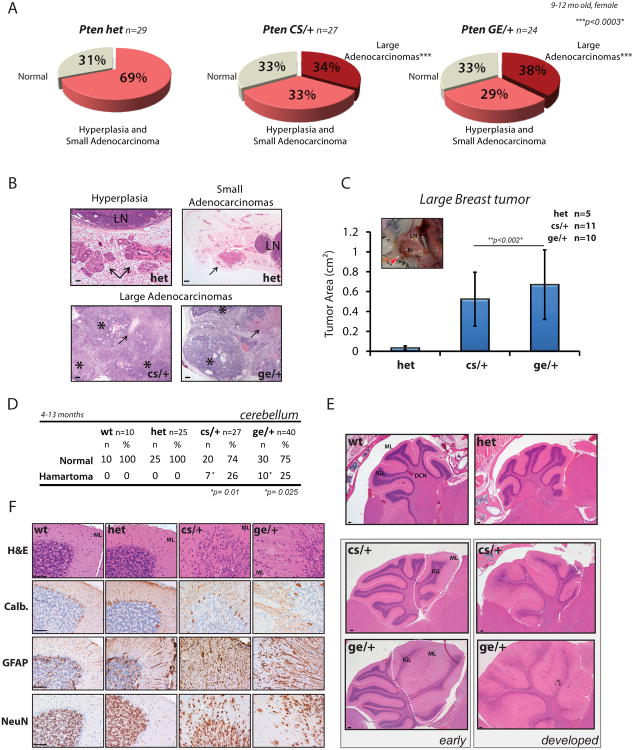
Figure 4. Dominant negative effect of PTEN cancer-associated mutations leads to enhanced tumorigenesis and development of hamartoma features.
(A) Pie-charts showing breast tumor distribution in Pten+/-, PtenC124S/+ and PtenG129E/+ female mice between 9 and 12 months of age.
(B) H&E staining of tumoral lesions found in breast tissues of Pten mouse lines. Top panels, arrows point to hyperplasia (left) and small adenocarcinomas (right) found in the 68.5% of Pten+/- mice (n=20 out of 29); LN, lymph-nodes (See also Figures S3E and S3F). Bottom panels, sections of large adenocarcinomas developing in 34% of PtenC124S/+ mice (n=9 out of 27), left, and 37.5% of PtenG129E/+ mice (n=9 out of 24), right. Asterisks indicate areas of epithelial expansion surrounded by connective tissue. Arrows point to areas of necrotic tissue found in the middle core of the tumors. Scale bar is 1mm in hyperplasia sample, top left; and 500μm in the remaining panels.
(C) Tumor area of large breast adenocarcinomas found in PtenKI mice. Inset, picture of large breast tumor (red arrow-head) developing in the inguinal fat-pad of a 9-month old PtenC124S/+ female mouse. Histogram shows average tumor area measured on paraffin blocks samples (side x side). Br, breast: LN, lymph-node. Mean values with associated SD are shown.
(D) Lhermitte-Duclos disease develops in the cerebellum of PtenKI mice. Table shows penetrance of disease in PtenC124S/+ (6 females and 1 male) and PtenG129E/+ mice (3 females and 7 males) (See also Figures S4D and S4G).
(E) H&E staining of cerebellar sections from Pten mouse lines. Top panel, histologically normal cerebellum from Pten+/+ and Pten+/- mice displaying: molecular layer (ML), internal granule cell layer (IGL), and deep cerebellar nuclei (DCN). Bottom panel, Lhermitte-Duclos disease in PtenKI mice present in small areas of early lesions, left, or developing through the entire cerebellum, right (See also Figure S4D). Scale bar is 1mm.
(F) Immunohistochemistry (IHC) of cerebellar sections from 10-month old Pten mouse lines. From the top: H&E staining shows disorganized granule cells spreading into the ML. Calbindin immunostaining shows dispersion of Purkinje cells due to granule cells overgrowth (GFAP immunostaining). NeuN immunostaining identifies presence of scattered neurons. Scale bar is 25 μm.

