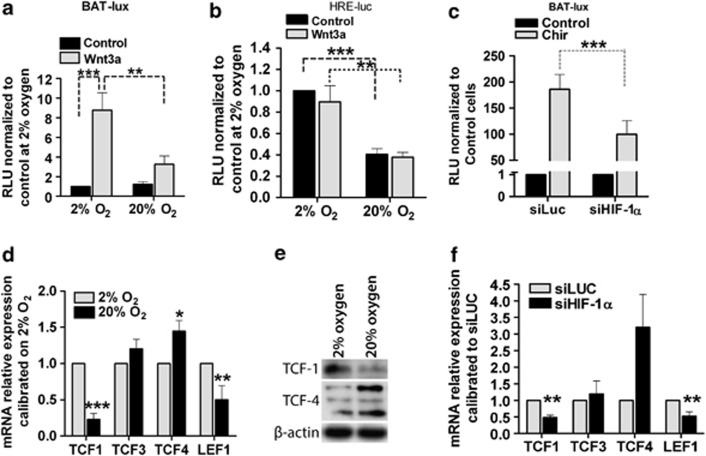
Figure 2.
Hypoxia modulates Wnt activation by regulating TCFs expression. (a) Bar graph representing luciferase reporter activity of BAT-lux transfected cells treated with Wnt3a and cultured at 2% O2 or 20% O2. Mean of six tumours±S.E.M., n=2 for each tumour. (b) Bar graph representing luciferase reporter activity of HRE-luc transfected cells treated with Wnt3a and cultured at 2% O2 or 20% O2. Mean of six tumours±S.E.M., n=2 for each tumour. (c) Bar graph representing luciferase reporter activity of HIF-1α silenced and control (siLuc) cells, transfected with BAT-lux and treated with CHIR99021. Mean of three tumours±S.E.M., n=2 for each tumour. (d) Real-time quantitative polymerase chain reaction (RQ-PCR) analysis of TCF-1, -3, -4 and LEF-1 in GBM cells maintained in hypoxia or exposed to 20% O2 tension. (e) WB representing TCF-1 and TCF-4 protein level in GBM cells at 2% or 20% oxygen tension. Analysis repeated on additional three tumours. (f) RQ-PCR analysis of TCF-1, -3, -4 and LEF-1 in GBM cells silenced for HIF-1α or transduced with a control vector (siLuc). Mean of three tumours±S.E.M., n=3 for each tumour. *P<0.05, **P<0.01, ***P<0.001

