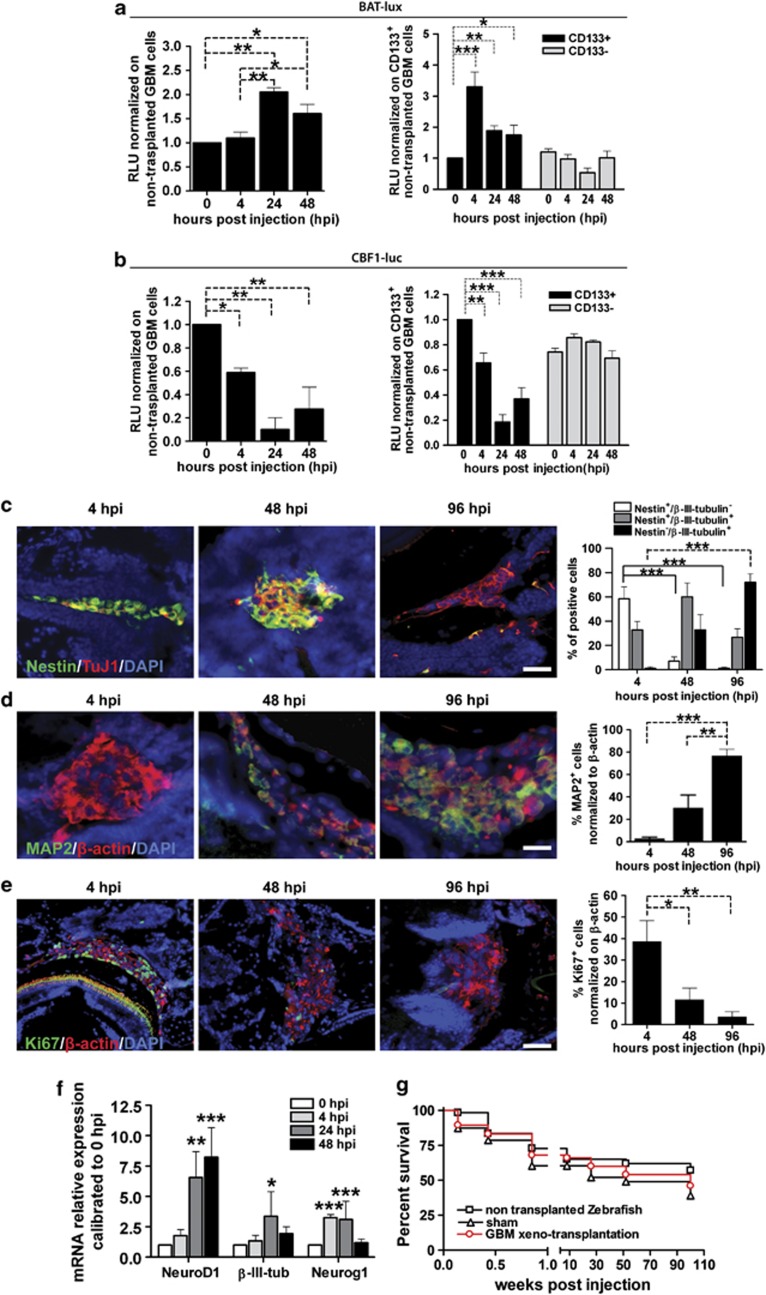
Figure 6.
Xeno-transplanted GBM-derived cells undergo neuronal differentiation and cell-cycle arrest. (a and b) BAT-lux (a) and CBF1-luc (b) reporter assays of human GBM grafted cells (left: injection of entire GBM cell population; right: injection of distinct CD133+ or CD133− sorted GBM cell populations). Values are expressed in RLU calibrated on non-transplanted GBM cells (0 hpi). Three different GBMs were analysed, n=4 for each tumour. (c–e) Representative immunofluorescence images of paraffin-embedded tissue sections of xeno-transplanted zebrafish larvae at 4, 48 and 96 hpi stained for (c) Nestin (green)/β-III-tubulin (red), (d) MAP2 (green)/β-actin (red), (e) Ki67 (green)/β-actin (red) (left panels) and bar graphs reporting relative quantifications (right panels). Bar=40 μm. For all graphs, mean of 10 tumours±S.E.M., n=10 for each tumour. (f) RQ-PCR analyses of NeuroD1, β-III-tubulin and Neurog1 expression normalized to Gusb and then calibrated to control cells (0 hpi) of human GBM cells grafted into zebrafish nervous system, mean±S.E.M., comparing three different GBM, n=4 for each tumour. (g) Survival graph of post-transplanted zebrafish compared with sham and non-injected larvae bred in the same conditions. Mean of 10 tumours injected±S.E.M., n=50 for each experimental group

