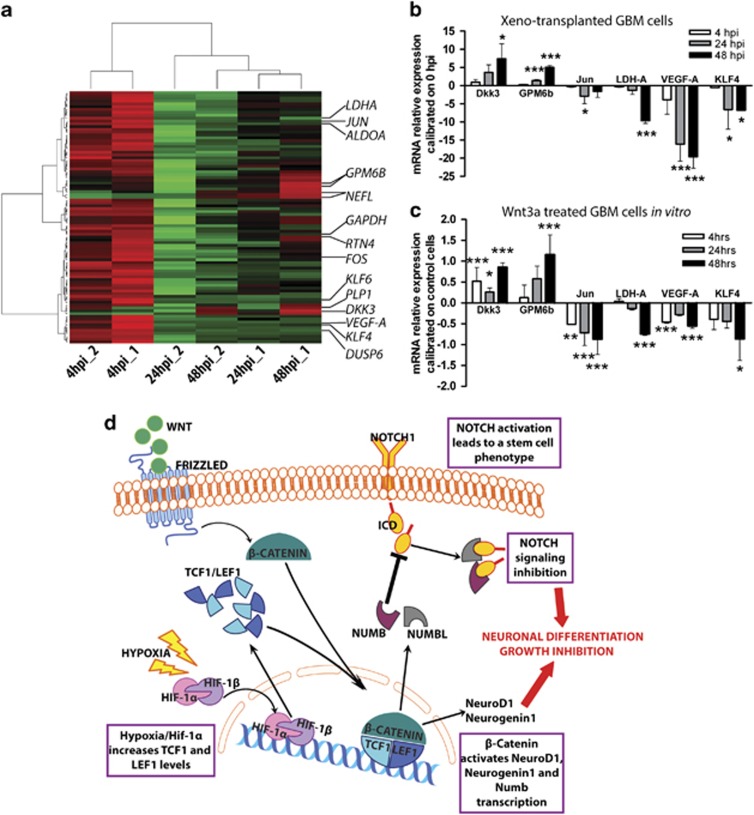
Figure 8.
Gene expression profile of xeno-transplanted GBM cells and validation of data. (a) Heatmap resulting from microarray analysis of two independent experiments of human GBM cells grafted into zebrafish nervous system at 4, 24 and 48 hpi. (b and c) RQ-PCR analyses of Dkk3, GPM6b, Jun, LDH-A, VEGF-A and KLF4 expression of xeno-transplanted GBM cells normalized to Gusb, then calibrated to control cells (0 hpi) (c) and Wnt3a in vitro treated GBM cells (c). Mean±S.E.M. comparing two different GBM, n=4 for each tumour. (d) Cartoon describing the HIF-1α, β-catenin and Notch reciprocal regulations proposed in this study. *P<0.05, **P<0.01, ***P<0.001

