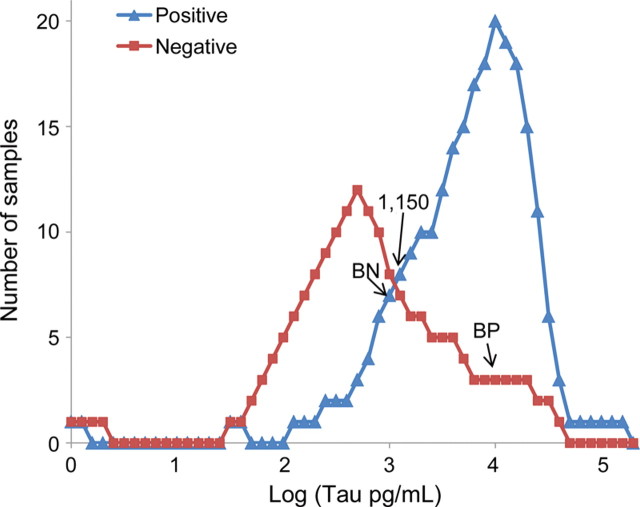
Figure 2. Histogram of distribution of tau values (log) per 0.1 log unit.
Positive Creutzfeldt-Jakob disease (CJD) cases (blue triangles) and negative cases (red squares) are shown. The log scale is used for clarity with tau values from 10 to 140,800 pg/mL. The most accurate cutoff of tau between cases positive and negative for CJD is 1,150 pg/mL. The prion disease-positive subjects were distributed as follows: 247 with tau at or above 1,150 pg/mL, 24 between 1,149 and 800 pg/mL, and 149 below 800 pg/mL. BN represents the level below which 10% of positive cases fall. BP represents the level above which 10% of negative cases fall.

