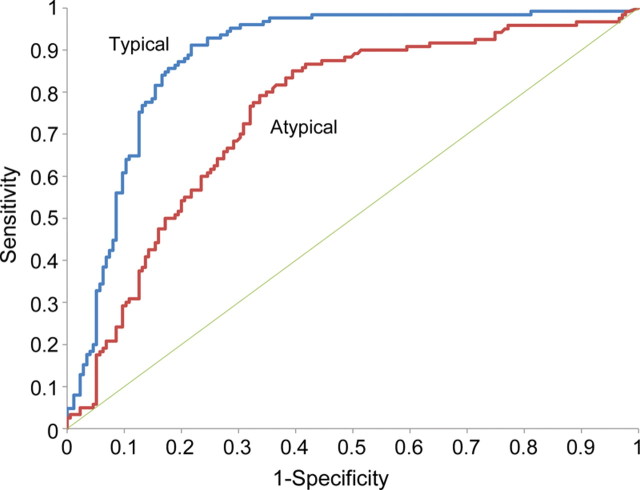
Figure 3. Diagnostic reliability of tau for “typical” and “atypical” cases.
The 2 receiver operating characteristic curves (typical and atypical) show greater area under the curve (AUC) for typical (0.886) vs atypical (0.750) cases (95% confidence interval for AUC for atypical is 0.667 to 0.833, which is lower than, and has no overlap with, the 95% confidence interval for typical, which is 0.840 to 0.932).

