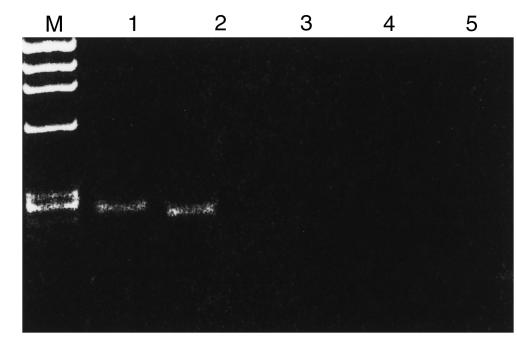
Figure 4.
RT-PCR analysis of chemokine expression in human CD34+KIT+ cells sorted by FACS®. Lanes 1–3 show MIP-1α, RANTES, and SDF-1, respectively. Lanes 4–6 show negative RT-PCR control reactions for MIP-1α, RANTES, and SDF-1, respectively. Data from 3 different donors was analyzed with similar results. Data from a representative donor are presented. Lane M, molecular weight marker (ΦX174 DNA/HaeIII).

