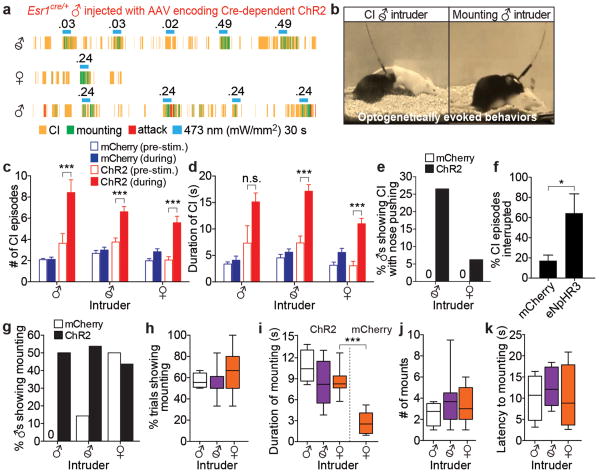
Figure 3. Esr1+ cells in VMHvl mediate close investigation (CI) and mounting behaviors.
a, b. Representative raster plots (a) and video stills (b) illustrating photostimulation-evoked mounting (a, green rasters; b, right) or CI (a, yellow rasters; b, left) in ChR2-expressing Esr1cre/+ males towards intruders of the indicated sex. c, d. Number (c) and duration (d) of CI episodes performed by males expressing mCherry (blue bars) or ChR2 (red bars), before (open bars) or during (filled bars) photostimulation, towards intruder males (n=4 each), castrated males (n=14 and n=18, respectively) or females (n=10 and n=12). ***p<0.001; two-way ANOVA with Tukey's multiple comparisons test. e. Aggressive sniffing (“CI with nose pushing”) during photostimulation by Esr1cre/+ males expressing mCherry (open bars) or ChR2 (filled bars) towards intruder castrated males (n=14 and n=49, respectively) or females (n=12 and n=32). f. Percentage of CI episodes interrupted by photostimulation ofEsr1cre/+ males expressing mCherry (n=7) or eNpHR3.0 (n=3). *p<0.05; Mann-Whitney U-test. g. Percentage of Esr1cre/+ males expressing mCherry (open bars) or ChR2 (filled bars) showing photostimulation-evoked mounting towards intruder males (n=4 and n=8, respectively), castrated males (n=14 and n=35) or females (n=10 and n=28). h-k. Quantification of photostimulation-evoked mounting towards intruder males (n=4), castrated males (n=11) or intact females (n=11; i, mCherry, n=5) towards females. ***p<0.001;Mann-Whitney U-test. Data are mean ± SEM (c-d) or median ± min and max values (h-k).

