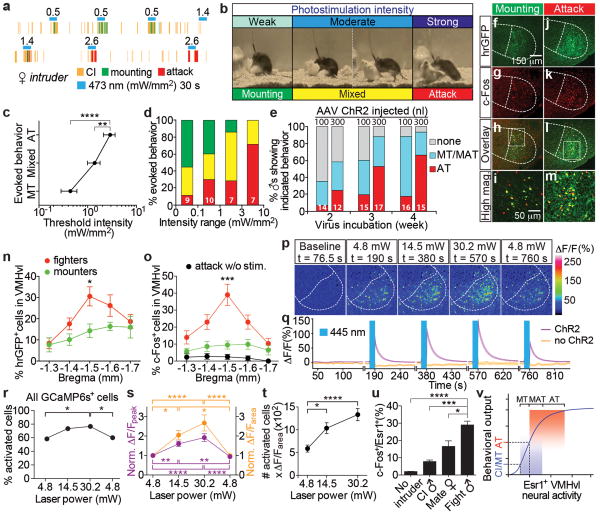
Figure 4. Behavioral responses shift from mounting to attack depending upon photostimulation intensity and the number of activated cells in VMHvl.
a-b. Representative raster plots (a) and images (b) illustrating shift from mounting to attack with increasing photostimulation intensity. c-d. Threshold photostimulation intensities evoking mounting, mixed or attack behavior (c, n=11), or (d) the relative percentage of those behaviors evoked by the indicated intensity range (n in bars). Data are from test sessions exhibiting multiple behaviors. **p<0.01, ****p<0.0001; two-way ANOVA with Tukey's multiple comparisons test. e. Proportion of photostimulation-evoked behaviors in animals injected with different amounts of AAV (100 vs. 300 nl), and incubated for different times post-injection (weeks). n within bars. Blue shading, mounting episodes with or without attack (“MT/MAT”). f-m. Double labeling for virally expressed hrGFP (f, j, h-i, l-m, native fluorescence) and photostimulation-induced c-Fos (g, k, i, m, anti-c-Fos, red) in solitary ChR2-expressing Esr1cre/+ males photostimulated 1 hr before sacrifice in their home cage, at an intensity that had previously evoked either mounting (f-i) or attack (j-m) several days earlier. i, m, boxed areas in h and l, respectively. n-o. Quantification of number of hrGFP+ (n) and c-Fos+ (o) cells in VMHvl across successive axial levels, following solitary photostimulation of “mounters” (green symbols, n=6) or “attackers” (red symbols, n=10), as in (f-m). Black symbols, no photostimulation prior to sacrifice (n=3). *p<0.05, ***p<0.001; two-way ANOVA with Tukey's multiple comparisons test. p-t. Two-photon Ca2+ imaging of acute hypothalamic slices expressing Cre-dependent ChR2-EYFP and Cre-independent GCaMP6s. p. Representative fluorescence images at the indicated time points and illumination power. q. Average Ca2+ transients in GCaMP6s+ cells with (purple trace, n=60) or without ChR2 (orange trace, n=48). Photostimulation (445 nm, 2-ms pulses, 20 Hz) was delivered for 10 s (blue bars in q). r. Percentage of GCaMP6s-expressing cells with ΔF/Fpeak>5 standard deviations from baseline, as a function of light power. *p<0.05; Pearson's Chi-square test. s. Normalized ΔF/Fpeak (purple) and ΔF/Farea (orange, integrated area under the curves in (q) during 30 s following photostimulation) as a function of light power, relative to cells activated at 4.8 mW (n=35). t. Number of activated cells × integrated activity per active cell, vs. laser power. s-t. *p<0.05, **p<0.01, ****p<0.0001; repeated measures one-way ANOVA. u, Percentage of c-Fos+ cells among Esr1+ neurons in VMHvl of wild-type animals following the indicated behaviors (control, n=3; CI, n=4; Mate, n=5; Fight, n=5). Data are mean ± SEM. n=number of animals (c-e, n-o, u) or cells (q-s).v. Threshold model for relationship between level of Esr1+ neuron activity and behavior. MT, mount only; MAT, mixed mount and attack; AT, attack only. See also Supplementary Note 2.

