
Extended Data Figure 4. Latency to attack depends on the initial orientation of the resident with respect to the intruder at the time of photostimulation.
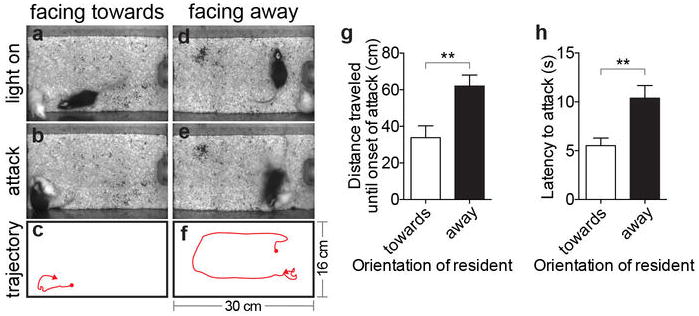
(a, b) and (d, e). Video stills illustrating initial position and orientation (“facing toward vs. away”) of a ChR2-expressing Esr1cre/+ male (black) towards a castrated male intruder (white) at the onset of photostimulation (a, d) and at the initiation of evoked attack (b, e). (c, f), trajectory plots showing the paths taken by the Esr1cre/+ males from the onset of photostimulation (red dots) to the onset of attack (red arrowheads). Cage dimensions indicated in f. (g, h). Quantification of distance traveled from onset of photostimulation to attack (g) and latency to attack (h), from data in (a-f) (n=11, **p<0.01, Mann-Whitney U-test). Note that if the resident is initially facing away from the intruder (d-f), the latency to attack is longer (h) because the resident initially moves in the direction that it was facing (f) and does not attack until it encounters the intruder at close range. Data are mean ± SEM. n=number of animals.