
Fig. 2. Block in early B-cell development in the absence of MYSM1.
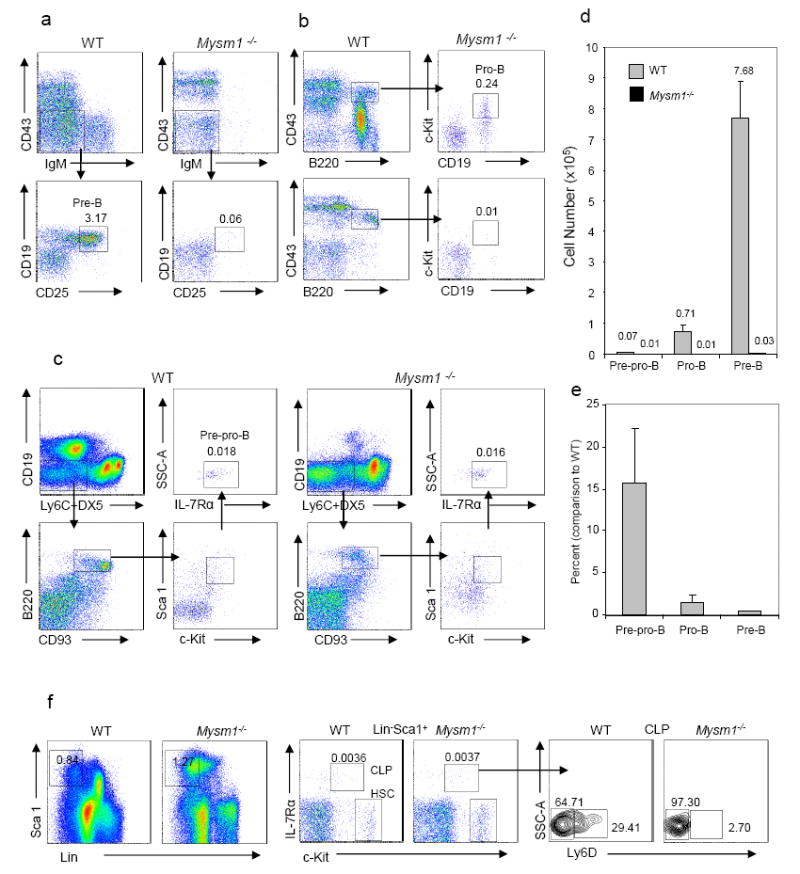
a-c. Representative flow cytometry of the bone marrow of ~6-week-old homozygous Mysm1-/-mice and WT littermates (n = 3-6 per group). Numbers adjacent indicate percentage of pre-B cells (CD19+CD25+IgM-CD43-) (a), pro-B cells (CD43+B220+CD19+c-Kit+) (b), and pre-pro-B cells (B220+CD19 -Ly6C-DX5-Sca1loc-KitloIL7Rα+CD93+) (c) in total BM nucleated cells.
d & e. Absolute numbers (d) of indicated cells in BM of Mysm1-/-mice and WT littermates per femur and percentages (e) of Mysm1-/-cell numbers compared to WT cell numbers (n = 3-6 per group) from one of three independent experiments.
f. Representative flow cytometry plots of bone marrow HSC (Lin-Sca1+c-Kit+), CLP (Lin-IL-7Rα+Sca1+c-Kit+) and Ly6D-or Ly6D+ CLP populations of Mysm1-/-mice and WT littermates (n = 4). Numbers adjacent indicate percents of indicated subpopulations.