Figure 5.
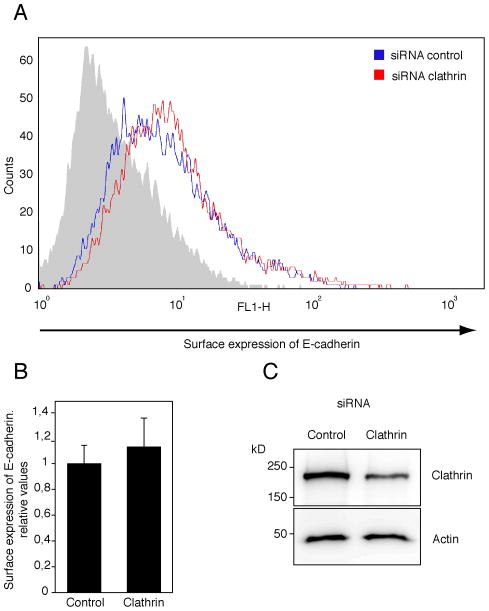
Surface expression of E-cadherin. (A) A representative of 6 independent flow cytometry assays is shown. Surface exposed E-cadherin was immunodetected in non-permeabized epithelial cells using a Alexa Fluor 488-labelled anti E-cadherin antibody (see methods) in control (blue line) and clathrin knock-down (KD) (red line) cells. Grey histogram shows the fluorescent background observed using a non-specific antibody Alexa Fluor 488-labeled. (B) Combined results from flow cytometry assays (as in A). The number of events (i.e. cells) with fluorescence signal above 101 are represented normalized to the control. As shown, clathrin depletion did not affect E-cadherin expression on HEK293 cell surface. Results are mean ± standard deviation of 6 independent experiments. (C) Protein KD by siRNA in HEK293 cells was verified by immunoblotting with antibodies against clathrin and β-actin (as loading control). Clathrin siRNA KD data were normalized to control siRNA (RNA not targeting any cellular mRNA). Clathrin KD cells expressed similar levels of dynamin as did control cells (see Supp Fig. 4).

