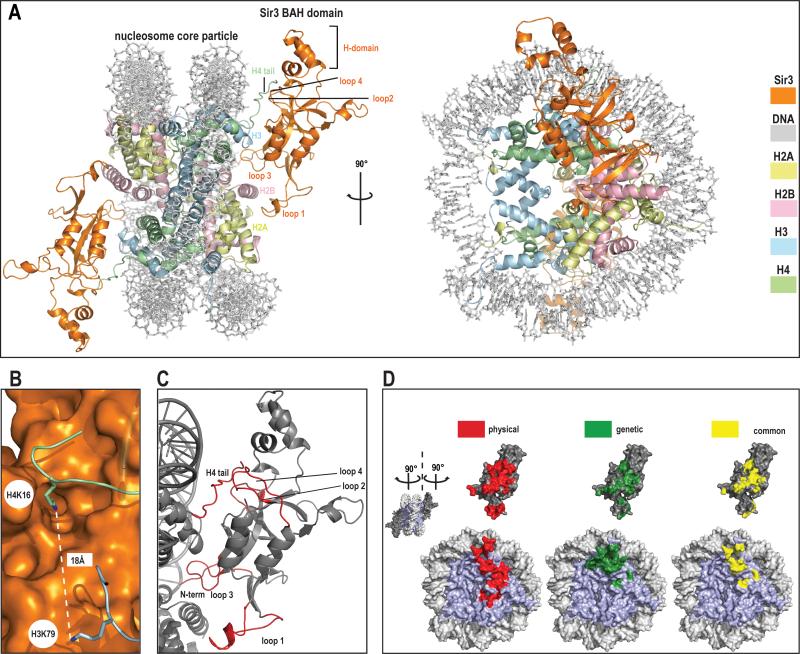
Figure 1. Crystal structure of Sir3 BAH domain with nucleosome core particle.
a) General overview of the structure.
Two different views of the complex; front view and view rotated by 90° around y axis. The structure is color coded (BAH domain is depicted in orange, H2A in yellow, H2B in light pink, H3 in blue, H4 in green and DNA in light grey).
b) Histone H4 K16 and histone H3 K79.
Both residues that are critical in the regulation of SIR complex mediated silencing are shown in this figure. Histone H4 K16 is depicted as stick in green, histone H3 K79 in blue, the BAH domain surface is rendered in orange.
c) Folding transitions in the complex.
Both the nucleosome and BAH domain are depicted in grey and regions that get folded upon interaction are shown in red.
d) Correlation between structural and genetic contacts.
‘Open book’ view of the complex. NCP surface is shown on the bottom and BAH domain on top of the figure. Surfaces colored in red represent physical contacts as seen in the structure. Surfaces colored in green represent residues both in the NCP and the BAH domains where mutation has been shown to impact silencing. Yellow surfaces represent the overlay of physical (structure-derived) and genetic contacts.

