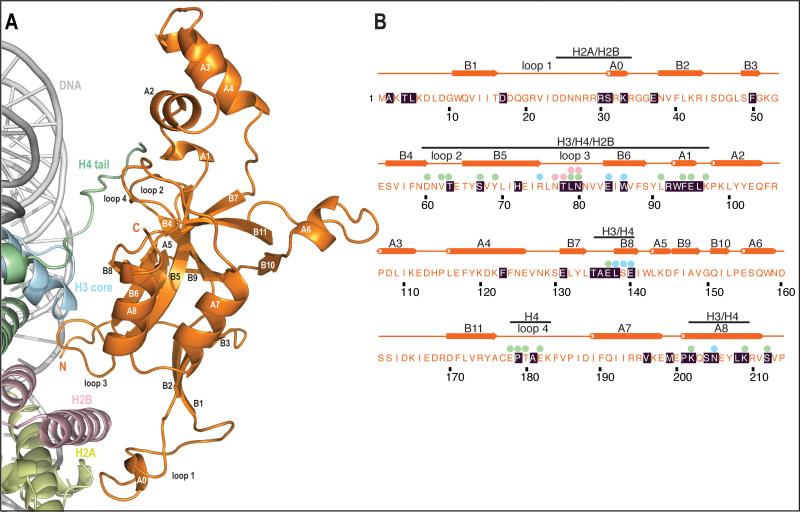
Figure 2. Overview of interactions in the complex.
a) Overview of interactions.
Same view as in Fig1a (front) BAH domain is depicted in orange, H2A in yellow, H2B in light pink, H3 in blue, H4 in green and DNA in light grey. Secondary structure elements are also depicted here. Secondary structure was assigned using KSDSSP.
b) Primary and secondary structure of D205N BAH.
Residues with black shading were mapped previously in genetic screens. Spheres above the sequence show histone interactions (within 4.1 Å) that are ordered and visible in the electron density. Colors of spheres represent which histone makes interaction with this residue of BAH domain. Bars above secondary structure inform which histone is interacting with this particular region of BAH domain. There are no spheres over residues in loop1 (residues 17-37) as this region is poorly ordered.

