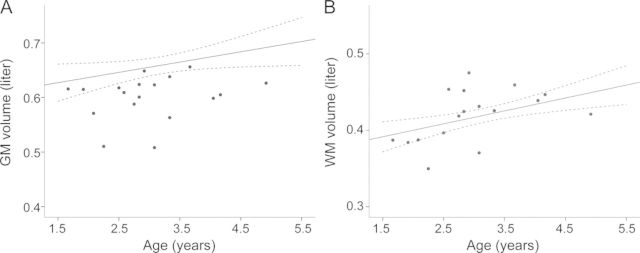
Figure 2. Gray matter (GM) and white matter (WM) volumes.

GM (A) and WM (B) volumes of controls (mean of linear regression line and its 95% confidence interval) and patients (single dots) showing less GM volume in patients, whereas WM volume was not different between patients and controls.
