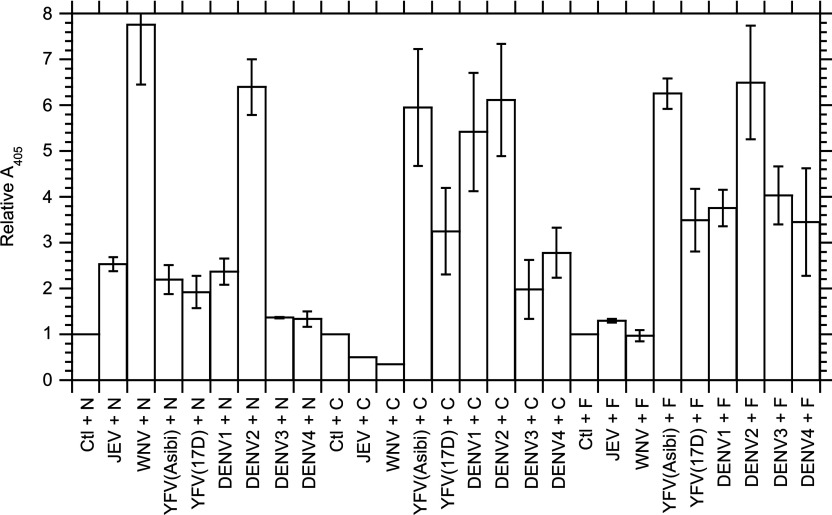
Figure 7. Comparison of the interactions between the ED3 domains of flaviviruses and RPSA derivatives at 25°C.
These interactions were measured by indirect ELISAs between (H6–ED3–PhoA)2 dimeric hybrids and immobilized RPSA derivatives as exemplified in Figure 6. The interactants are given along the x-axis: The (H6–ED3–PhoA)2 dimers are represented by the acronym of the virus from which they derived; Ctl, (H6–PhoA)2 control without any ED3 domain; N, RPSA-(2–220); C, RPSA-(225–295); F, RPSA-(2–295). The relative strength Sr of the interaction is given along the y-axis; it was calculated by eqn (11) as the relative slope of the linear dose–response curve in the indirect ELISA, taking the slope equal to 1 for the (H6–PhoA)2 control. Each column gives the mean and associated S.E.M. in at least three independent experiments.

