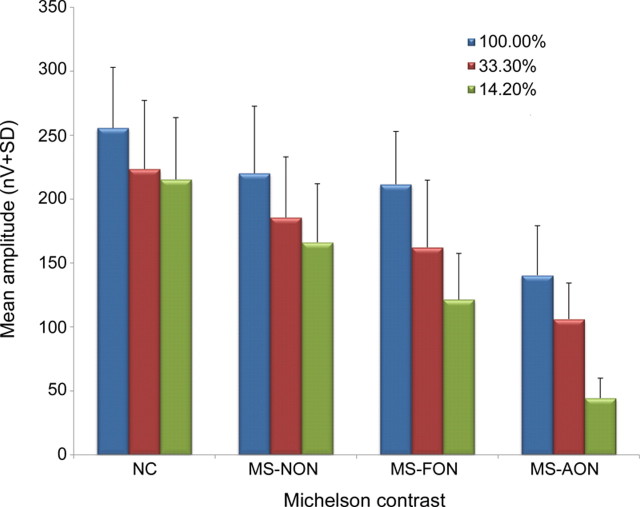
Figure 2. Mean amplitudes of multifocal visual evoked potential (mfVEP) responses.
This figure demonstrates the mean amplitudes of the mfVEP (means ± SD) in nV, across different levels of Michelson contrast pattern-reversal stimulation. Eyes from patients with multiple sclerosis with a history of AON (MS-AON) exhibited a significant attenuation in the mean amplitude responses to 100%, 33.3%, and 14.2% Michelson contrast pattern-reversal stimulation, when compared normal subjects (p < 0.0001 for all), and with respect to 33.3% and 14.2% contrast stimulation when compared to100% Michelson contrast stimulation (p < 0.0001 for both). Significant attenuation was also observed in 42% of eyes from MS-NON patients, and 57% of MS-FON eyes (p < 0.001 for both). A modest and insignificant reduction in mean amplitude response was observed in normal subject eyes with low and very low contrast stimulation. MS-FON = unaffected fellow eye; NC = normal control.

